Example 11: Ring windows for texture pipelines: intensity[frame, window, azimuth], one file per input file
Texture tomography needs, for every frame, the intensity of a few Bragg rings as a function of azimuth. The conveyor gives exactly that: for each ring a window of radial bins of pyFAI's normalised 2D cake, summed, with a background window either side of it and no background subtracted, so the reader decides what to do with the three. The sparse pixels of the same frames come from the same pass. The files follow the input files and their frame order: sorting frames into scan order is left to the reader. Where the rings are is user input: usually decided the unit cell and a user selection of which hkl to use and the width ranges to harvest.
Source: examples/ex11_rings_per_frame.py, run as python examples/ex11_rings_per_frame.py, or download the notebook (figures and output as run when this page was built).
Output, from running it when this page was built, on a synthetic stand-in for your files (powder rings with noise on an Eiger-like detector, tools/standin.py; with your own data the numbers are yours):
import glob
import os

import h5py
import hdf5plugin  # registers the bitshuffle filter, so that h5py can decompress too
import numpy as np
import pyFAI
from pyFAI.method_registry import IntegrationMethod

from bslz4_to_sparse import conveyor
h5pattern = "eiger_*.h5"  # your files: bitshuffle-compressed, one frame per chunk
h5dataset = "/entry_0000/ESRF-ID11/eiger/data"  # the (nframes, ni, nj) dataset inside each
mask_filename = (
    "mask.h5"  # your detector mask: a dataset "mask", pyFAI's convention (non-zero = masked)
)
poni_filename = "calib.poni"  # your pyFAI geometry
outdir = "rings_out"
h5filenames = sorted(glob.glob(h5pattern))
for name in h5filenames:
    conveyor.write_index(conveyor.harvest(name, h5dataset), name)
units, shape, dtype = conveyor.make_work_units(h5filenames, h5dataset)
with h5py.File(h5filenames[0], "r") as h5:
    summed = h5[h5dataset][:20].sum(
        axis=0, dtype=np.float64
    )  # the first frames, for a clearer pattern
with h5py.File(mask_filename, "r") as h5:
    bad = h5["mask"][()] != 0  # the masked pixels
ai = pyFAI.load(poni_filename)
mask = (~bad).astype(np.uint8)  # ours: 1 = use this pixel
WARNING:silx.opencl.common:Unable to import pyOpenCl. Please install it from: https://pypi.org/project/pyopencl
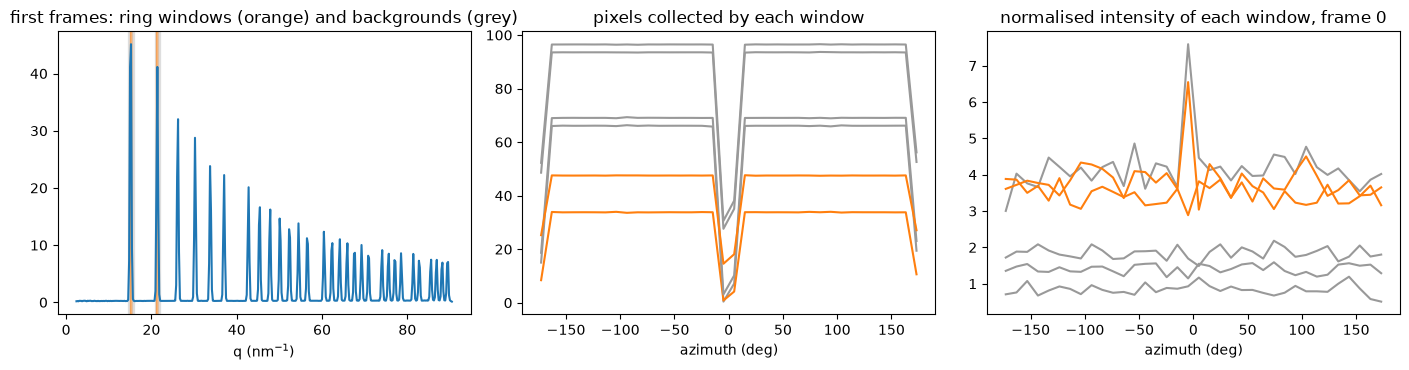
Where are the rings? Here: the two strongest peaks of the 1D pattern of the first frames, decided by eye in practice. Windows of 0.4 nm^-1 on each ring, and 0.4 either side as background.
method = IntegrationMethod.select_one_available(("bbox", "csc", "cython"), dim=1)
pattern = ai.integrate1d(summed, 400, unit="q_nm^-1", method=method, mask=bad)
smooth = np.convolve(pattern.intensity, np.ones(3) / 3, mode="same")  # noise makes spikes
peaks = np.flatnonzero((smooth[1:-1] > smooth[:-2]) & (smooth[1:-1] >= smooth[2:])) + 1
centres = np.sort(pattern.radial[peaks[np.argsort(smooth[peaks])[::-1][:2]]])
ranges, ring, role = conveyor.peak_windows(centres, 0.4, background_width=0.4)
print("ring centres (q, nm^-1):", np.round(centres, 2).tolist())
ring centres (q, nm^-1): [15.21, 21.39]
One matrix: a 2D (radial x azimuth) cake of 400 x 36 bins, then the sums over the windows of the normalised cake: dividing by the per-bin number of pixels is folded into the weights.
cake = conveyor.Integrator.from_pyfai(ai, 400, unit="q_nm^-1", npt_azim=36, mask=bad)
rings = cake.rings(ranges)
exact=False: the ring weights fold in the normalisation, they are not a sum of counts
backend = conveyor.CpuBackend(mask, dtype, csc=rings.csc, cut=3, howmany=5000, exact=False)
result = conveyor.run(
    units,
    backend,
    workers=2,
    sink=lambda k: conveyor.TeeSink(
        conveyor.RingSink(rings, outdir, h5dataset, ring, role),
        conveyor.ImageD11SparseSink(outdir, h5dataset),  # the sparse pixels, from the same pass
    ),
)
print(conveyor.report(result))
36 frames of 3 files in 0.0 s with 2 threads: 925 frames/s
input  0.008 GB compressed, 0.210 GB/s (file span read 0.210 GB/s)
output 0.000 GB as handed to the sink, 0.004 GB/s, 0.0212 of the input
workers: 60% decode, 22% sink, 1% idle; readers 2% reading
with h5py.File(
    os.path.join(outdir, conveyor.rings_name(h5filenames[1 % len(h5filenames)])), "r"
) as h5:
    g = h5[h5dataset.strip("/")]
    intensity, roles, nbins = g["intensity"][:], g["role"][:], g["window_nbins"][:]
# frames, windows (below, ring, above, for each ring), azimuth bins
assert intensity.shape[1:] == (6, 36) and list(roles) == [-1, 0, 1] * 2
per_bin = intensity.mean(axis=(0, 2)) / nbins  # mean intensity per radial bin, each window
print("mean intensity per radial bin, for each window:", np.round(per_bin, 3).tolist())
print("intensity %s: frames, windows %s, azimuth bins" % (intensity.shape, list(roles)))
mean intensity per radial bin, for each window: [2.074, 3.755, 0.414, 0.915, 3.421, 0.735]
intensity (12, 6, 36): frames, windows [np.int8(-1), np.int8(0), np.int8(1), np.int8(-1), np.int8(0), np.int8(1)], azimuth bins
A picture, and the reason the windows are normalised. Left: the windows on the powder pattern. Middle: how many pixels (weighted) each window collects at each azimuth: the module gaps and the detector edge take pixels away at some azimuths, so a raw sum would show them as dips in the ring that are not there in the sample. Right: the normalised intensity of each window of frame 0, which is what the file holds.
import matplotlib.pyplot as plt
azimuth = cake.azimuthal
fig, axes = plt.subplots(1, 3, figsize=(14, 3.8))
axes[0].plot(pattern.radial, pattern.intensity)
for (lo, hi), r in zip(ranges, role):
    axes[0].axvspan(lo, hi, color="C1" if r == 0 else "0.8", alpha=0.5)
axes[0].set_xlabel("q (nm$^{-1}$)")
axes[0].set_title("first frames: ring windows (orange) and backgrounds (grey)")
pixels = cake.norm.reshape(len(cake.radial), len(azimuth))  # pixels per (radial, azimuth) bin
for w, (lo, hi) in enumerate(ranges):
    inside = (cake.radial >= lo) & (cake.radial < hi)
    axes[1].plot(azimuth, pixels[inside].sum(axis=0), color="C1" if role[w] == 0 else "0.6")
axes[1].set_xlabel("azimuth (deg)")
axes[1].set_title("pixels collected by each window")
for w in range(len(ranges)):
    axes[2].plot(azimuth, intensity[0, w], color="C1" if role[w] == 0 else "0.6")
axes[2].set_xlabel("azimuth (deg)")
axes[2].set_title("normalised intensity of each window, frame 0")
plt.tight_layout()
plt.show()
Generated by tools/generate_docs.py from bslz4_to_sparse 0.0.22a2 (git v0.0.22-13-g610ed27, sources sha256 6929bd75ab7a).